TL;DR version —
Click here to check out my new Shiny app, which displays the U.S. seasonal influenza severity index as calculated from Centers for Disease Control and Prevention ILINet data from 1997-98 to 2013-14.
My recent paper proposed new methods for quantifying seasonal influenza severity by looking at the relative risk of influenza-like illness between adults and children at varying points in the flu season in the United States. Don’t worry, this isn’t a repeat of my recent blog post on the paper itself.
As a proponent of open science, I had always been planning to post the code I had used to generate the data and figures that appear in the main manuscript. Due to the proprietary uses of the medical claims data, the primary data source in the paper, however, it was clear that we could not post any of the data itself. In these circumstances, I asked myself — why post code that wouldn’t add value beyond the findings of the paper?
As an alternative, I’m excited to announce the launch of a web application that displays the seasonal influenza severity index, as calculated with U.S. CDC’s ILINet data. These data are publicly available from CDC’s website through FluView Interactive, and I showed these results in the Supporting Material. The original analyses were conducted in Python, but I’ve developed the web application with the Shiny package in R (post to follow about that experience!).
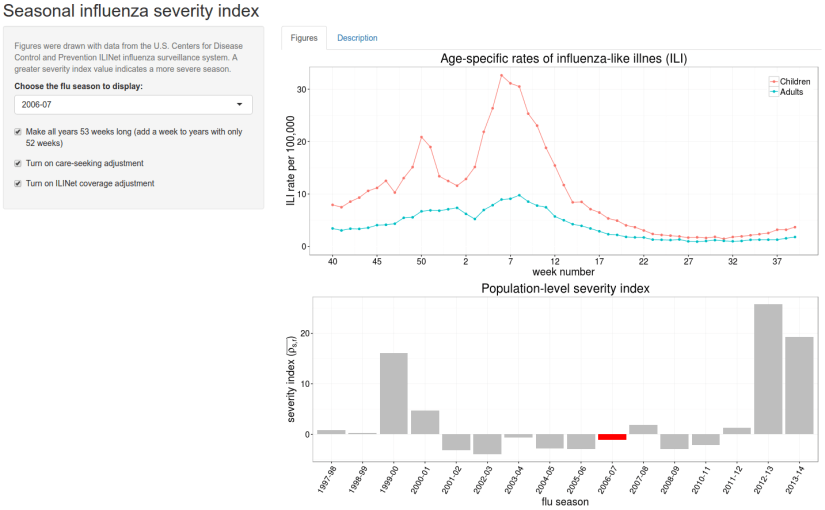
Data from the 1997-98 to 2013-14 flu seasons are pre-loaded into the application. Users can use the drop-down menu to view two figures from a specific season: 1) adult and child ILI rates from week 40 (first week of October) to week 39 in the following year, and 2) the population-level severity index, as calculated according to the methods in the paper.
The goal of this web application is to make the results and “intuition” derived from the paper more accessible to researchers, policymakers, and the public. I hope to add features to the application in the future (e.g., ability for users to upload their own data), so suggestions are welcome!
Check out the seasonal influenza severity index application here!